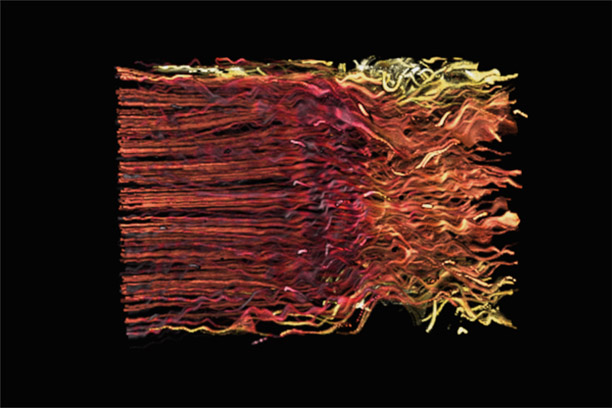

Color remains one of the best means of conveying information
about related scalar quantities over a volume rendered flow. In the image
on the top, color varies from red to yellow with increasing temperature,
highlighting the effects of friction across the boundary layers in this flow.
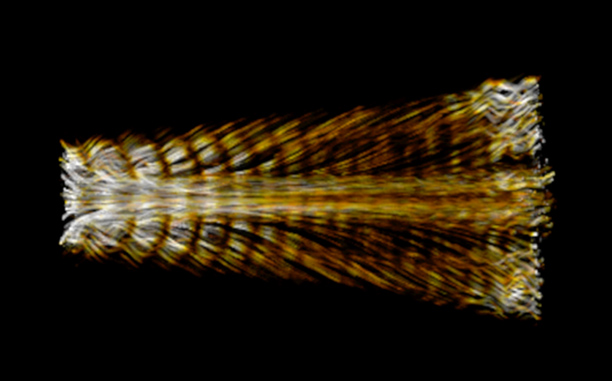
In the image on the bottom, saturation increases with increasing streamwise
vorticity across the same set of streamlines, subtly emphasizing the areas
of greatest turbulence.
In this image, color is used as an additional variable to represent the
magnitude of the vorticity across the flow volume.
This particular visualization conveys the pressure waves that are
being propagated down the axis of the flow.
 To my main page on 3D Flow representation
Back to my home page