Feature Extraction for Visualization
One of the key challenges in effectively conveying complex information is carefully choosing what features to show. I have been interested in this research area for many years, working closely with colleagues in a variety of disciplines to help define methods for effectively extracting and visually representing key data features to facilitate the understanding of complicated 3D data.
|
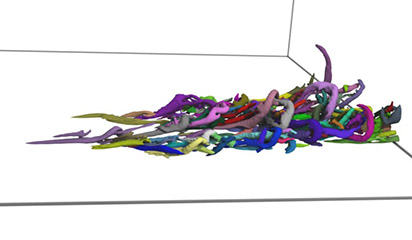
Identifying Individual Eddy Structures in Turbulent Flow, Shengwen Wang, Jack Goldfeather, Ellen Longmire and Victoria Interrante (2013) Tsinghua Science and Technology, special issue on Visualization and Visual Analytics, 18(2), April 2013, pp. 125-136.
[PDF]
[abstract]
|
Turbulent flows are intrinsic to many processes in science and engineering, and efforts to elucidate the physics of turbulence are of critical importance to many fields. However, ongoing efforts to achieve a fundamental understanding of the mechanisms of turbulent flow are hindered by the difficulty of quantifying the complex, nonlinear interactions between individual eddies in these flows. The difficulty of this task is compounded by the lack of robust methods for accurately identifying individual eddy structures and characterizing their dynamic evolution and organization across multiple scales. In this paper we address this problem by proposing several novel approaches for more accurately segmenting individual eddy structures in turbulent flows.
|
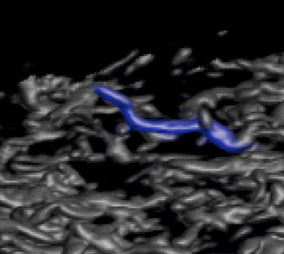
Real Time Feature Extraction for Analysis of Turbulent Flows, Ivan Marusic, Graham Candler, Victoria Interrante, Pramod Subareddy and Alin Moss (2001) in Data Mining for Scientific and Engineering Applications, R.L. Grossman, C. Kamath, P. Kegelmeyer, V. Kumar and R.R. Namburu, eds., Kluwer Academic Publishing., pp. 223-238.
[PDF]
[abstract]
|
The study of fluid flow turbulence has been an active area of research for over 100 years, mainly because of its technological importance to a vast number of applications. In recent times with the advent of supercomputers and new experimental imaging techniques, terabyte scale data sets are being generated, and hence storage as well as analysis of this data has become a major issue. In this chapter we outline a new approach to tackling these data sets which relies on selective data storage based on real-time feature extraction and utilizing data mining tools to aid in the discovery and analysis of the data. Visualization results are presented which highlight the type and number of spatially and temporally evolving coherent features that can be extracted from the data sets as well as other high level features.
|
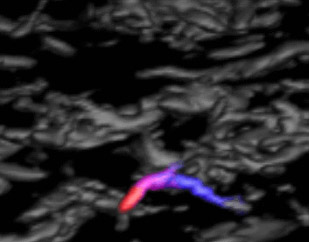
Detection and Tracking of Coherent Features in a Mach 4 Turbulent Boundary Layer, Ivan Marusic, Graham V. Candler, Victoria Interrante, M. Pino Martin, Pramod K. Subbareddy and Alin Moss (2000) American Institute of Aeronautics and Astronautics Conference, Paper No. 2000-2414, Denver, June 2000.
[PDF]
[abstract]
|
The detection and tracking of coherent vortical structures in a turbulent compressible boundary layer is considered. Several vortex identification methods are evaluated. It is found that for this flow, the discriminant of the characteristic polynomial of the velocity gradient tensor is the most useful. It tends to highlight vortical structures that are located farther from the wall, and the feature detection is less sensitive to the level than the other methods evaluated. The flow fields are visualized using advanced volume rendering methods that allow large datasets to be analyzed efficiently. These methods have also been adapted to volume fill specific structures so that their evolution can be tracked in time. These approaches promise to make the analysis of large DNS datasets more efficient and quantitative.
|
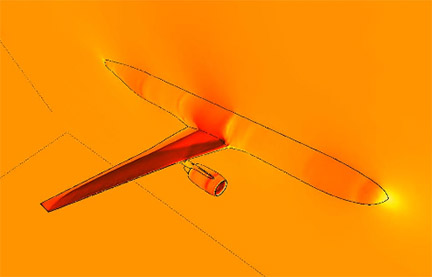
Extracting Feature Lines from 3D Unstructured Grids, Kwan-Liu Ma and Victoria Interrante (1997) IEEE Visualization, pp. 285-292.
[PDF]
[abstract]
|
This paper discusses techniques for extracting feature lines from three-dimensional unstructured grids. Our twin objectives are to facilitate the interactive manipulation of these typically very large and dense meshes, and to clarify the visualization of the solution data that accompanies them. We describe the perceptual importance of specific viewpoint-dependent and view-independent features, discuss the relative advantages and disadvantages of several alternative algorithms for identifying these features (taking into consideration both local and global criteria), and demonstrate the results of these methods on a variety of different data sets.
|
Enhancing Transparent Skin Surfaces with Ridge and Valley Lines, Victoria Interrante, Henry Fuchs and Stephen Pizer (1995) IEEE Visualization, pp. 52-59.
[PDF]
[abstract]
|
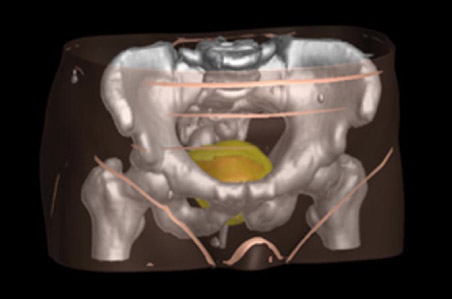
There are many applications that can benefit from the simultaneous display of multiple layers of data. The objective in these cases is to render the layered surfaces in a such way that the outer structures can be seen and seen through at the same time. This paper focuses on the particular application of radiation therapy treatment planning, in which physicians need to understand the three-dimensional distribution of radiation dose in the context of patient anatomy.
We describe a promising technique for communicating the shape and position of the transparent skin surface while at the same time minimally occluding underlying isointensity dose surfaces and anatomical objects: adding a sparse, opaque texture comprised of a small set of carefully-chosen lines. We explain the perceptual motivation for explicitly drawing ridge and valley curves on a transparent surface, describe straightforward mathematical techniques for detecting and rendering these lines, and propose a small number of reasonably effective methods for selectively emphasizing the most perceptually relevant lines in the display.
|
Multiscale, Geometric Image Descriptions for Interactive Object Definition, Stephen M. Pizer, John M. Gauch, James M. Coggins, Tim J. Cullip, Robin E. Fredericksen and Victoria Interrante (1989) Mustererkennung 1989 (Proceedings of the 11th Symposium of the German Association for Pattern Recognition), H. Burkhardt, K.-H. Höhne and B. Neumann, eds., Springer, pp. 229-239.
[PDF]
[abstract]
|
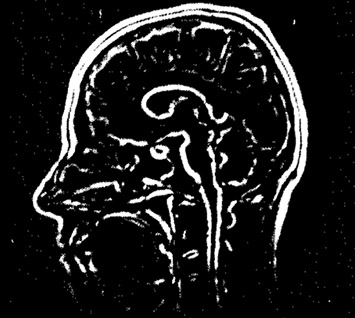
A means is described of analyzing two- and three-dimensional images into a directed acyclic graph of visually sensible, coherent regions and of using this DAG as the basis for interactive object definition. The image analysis is in terms of the geometry of the intensity surface via a multiscale approach with a focus on symmetry properties about ridges. The image analysis method, a system for interactive object definition, and results of their use on two-dimensional images are reported.