Learning to Predict Trustworthiness with Steep Slope Loss
Yan Luo1, Yongkang Wong2, Mohan Kankanhalli2, and Qi Zhao1
University of Minnesota1, National University of Singapore2
Abstract
Understanding the trustworthiness of a prediction yielded by a classifier is critical for the safe and effective use of AI models. Prior efforts have been proven to be reliable on small-scale datasets. In this work, we study the problem of predicting trustworthiness on real-world large-scale datasets, where the task is more challenging due to high-dimensional features, diverse visual concepts, and large-scale samples. In such a setting, we observe that the trustworthiness predictors trained with prior-art loss functions, i.e., the cross entropy loss, focal loss, and true class probability confidence loss, are prone to view both correct predictions and incorrect predictions to be trustworthy. The reasons are two-fold. Firstly, correct predictions are generally dominant over incorrect predictions. Secondly, due to the data complexity, it is challenging to differentiate the incorrect predictions from the correct ones on real-world large-scale datasets. To improve the generalizability of trustworthiness predictors, we propose a novel steep slope loss to separate the features w.r.t. correct predictions from the ones w.r.t. incorrect predictions by two slide-like curves that oppose each other. The proposed loss is evaluated with two representative deep learning models, i.e., Vision Transformer and ResNet, as trustworthiness predictors.
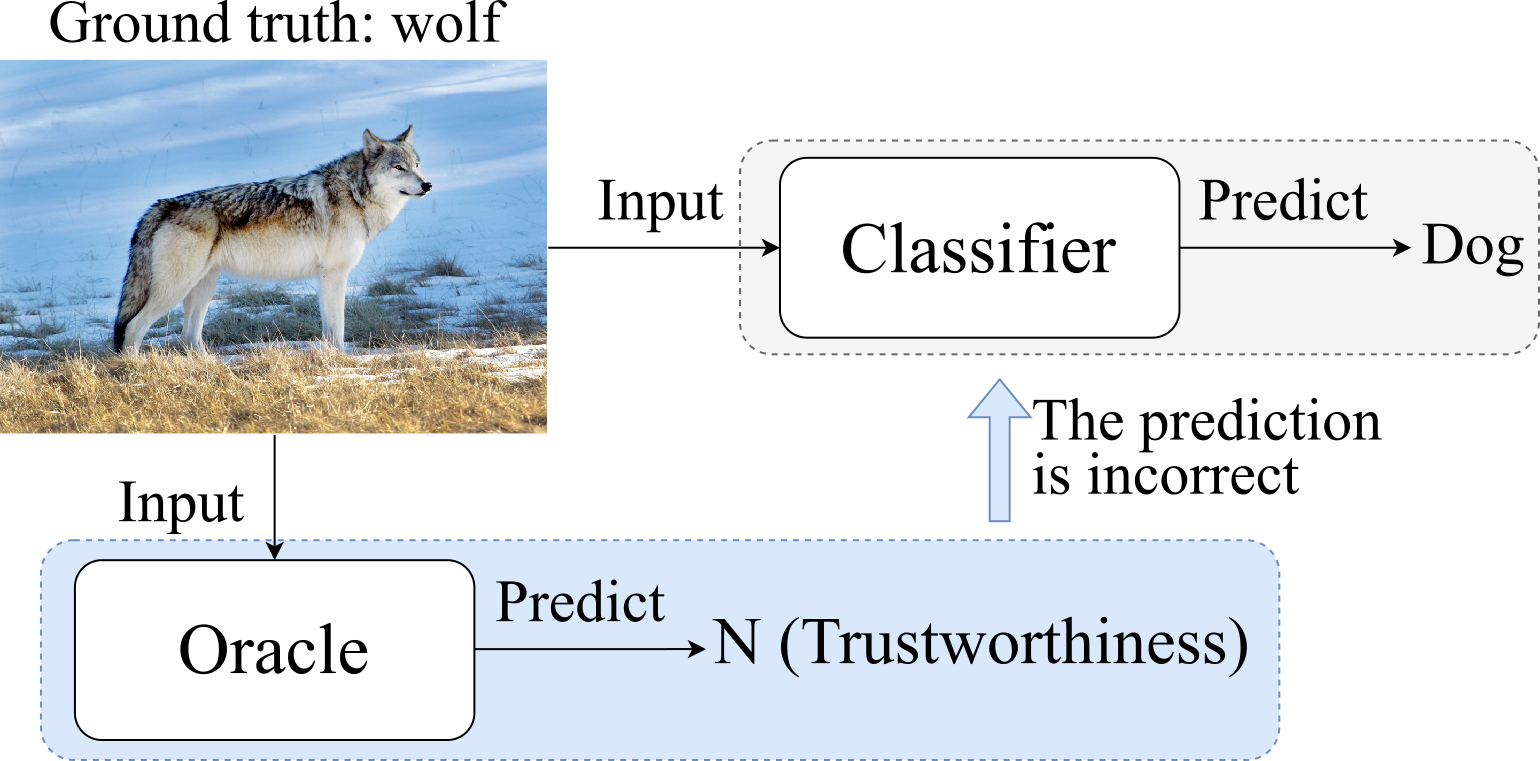
When the image is misclassified, we hope the trustworthiness predictor, that is, oracle, can assess the trustworthiness of the prediction. In this way, it is able to raise a red flag that the classifier yields an incorrect prediction.
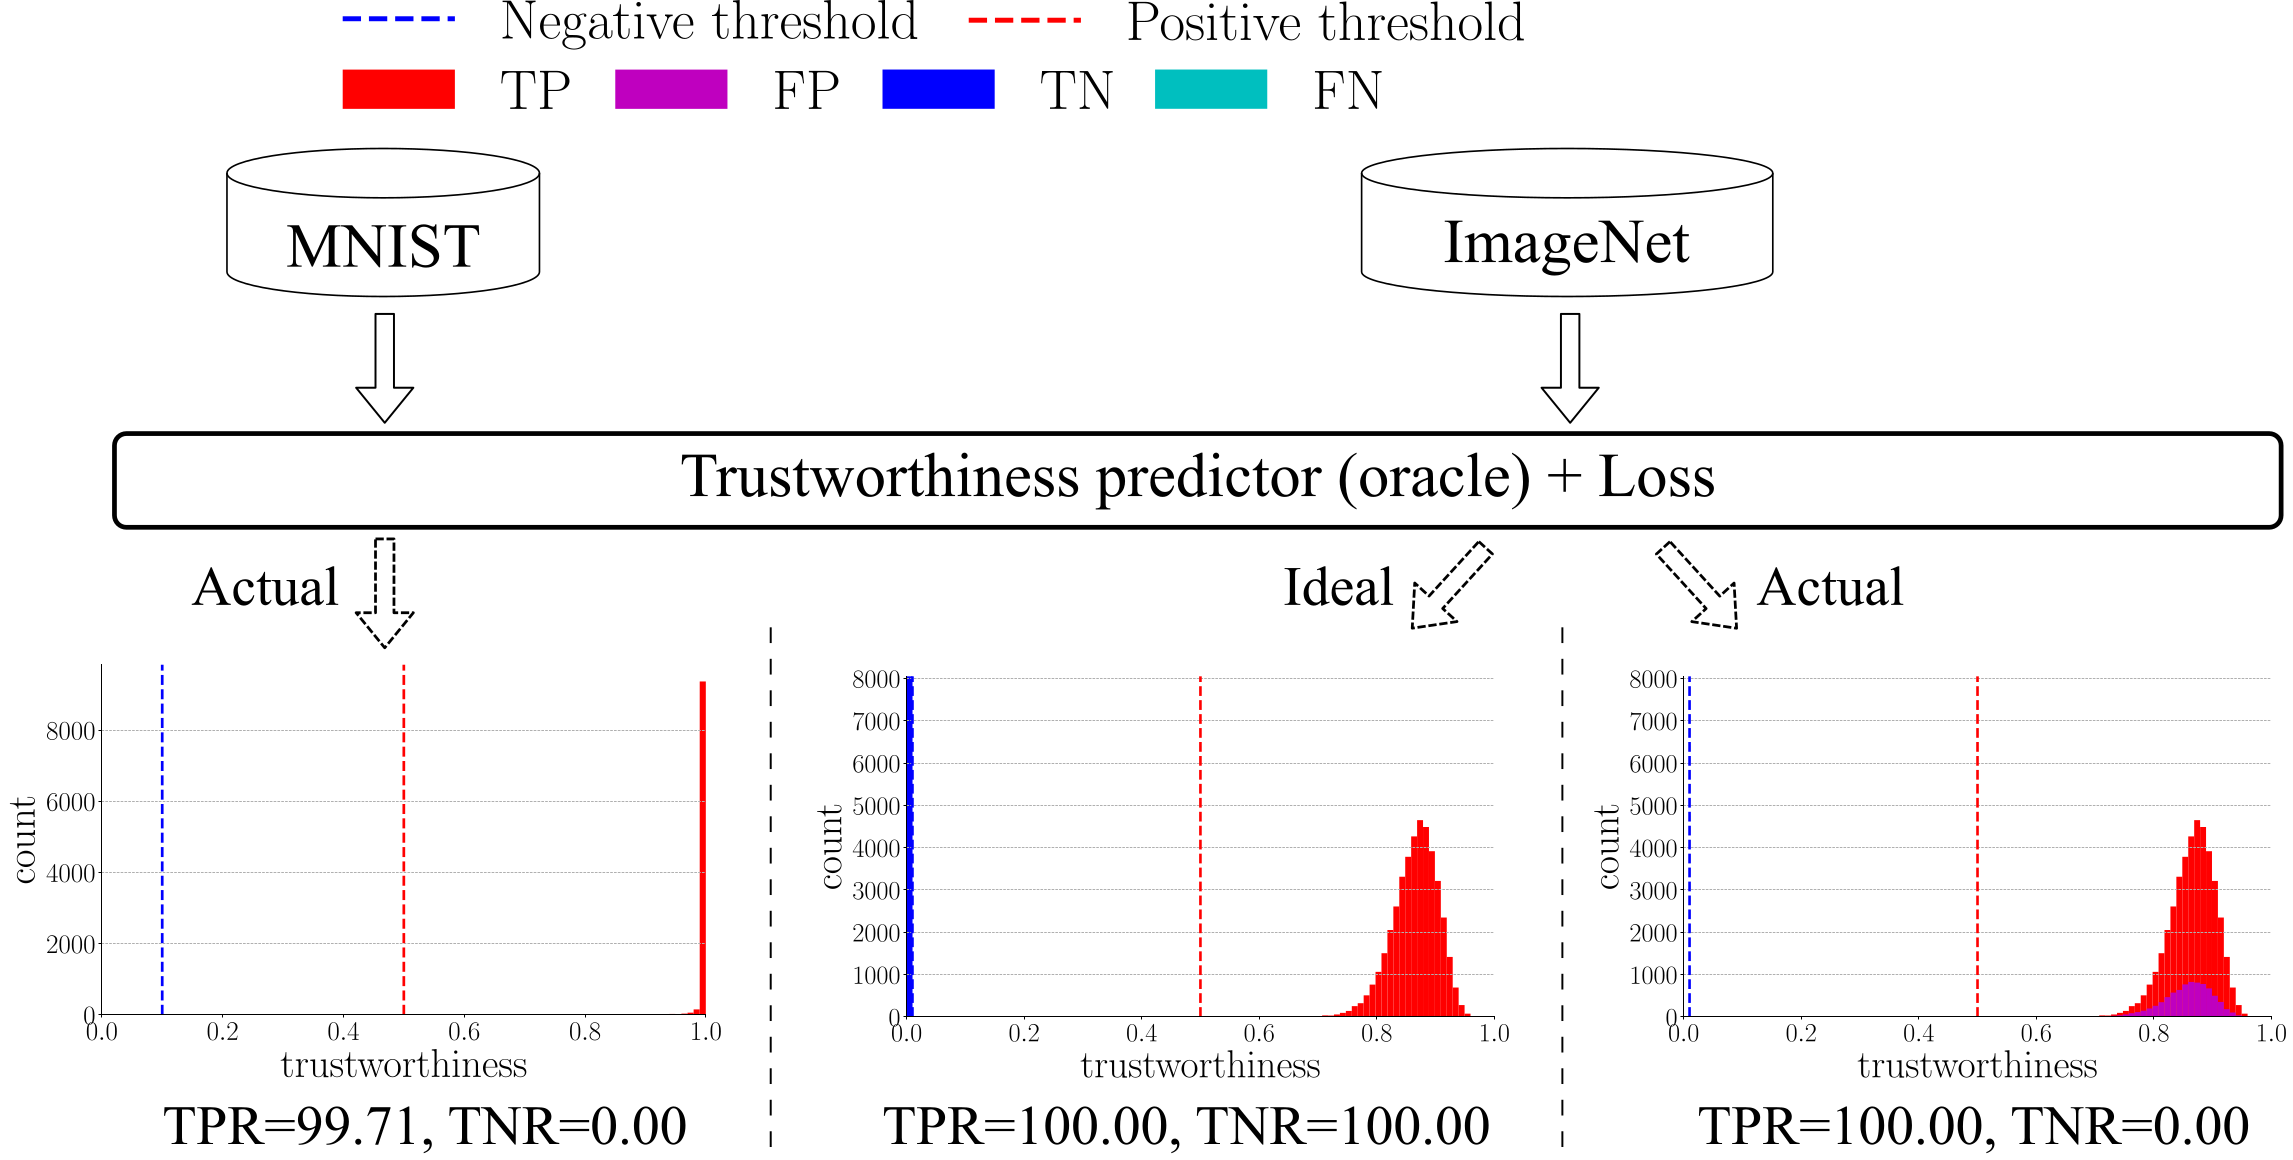
The prior-art method, true class probability (TCP for short) almost recognizes all the positive samples on MNIST. Ideally, we expect the method can correctly separate negative samples from positive samples on the large-scale datasets as well. In other words, all negative samples go to the left of blue dashed line and all positive samples go to the right of red dashed line. Nevertheless, the task is more challenging on large-scale datasets due to high-dimensional features, diverse visual concepts, and a large number of samples.
Methodology
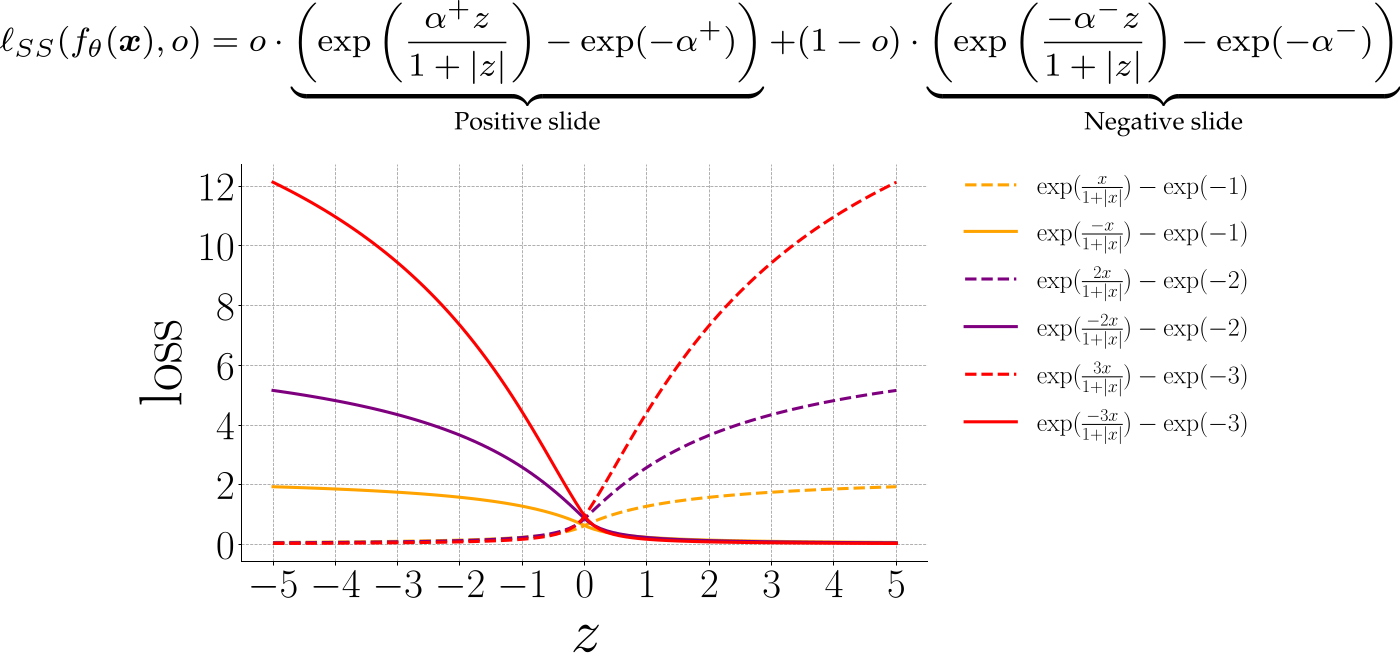
Given an image x, corresponding label y, and a classifier, ground-truth trustworthiness score o is 1 if the predicted label is correct, 0 otherwise. With o, the discriminative feature z generated by the oracle is fed to a function of a positive slide or negative slide. Alpha controls the slope of the slide. Minimizing the loss would push the point on the hill down to the bottom, namely, the long tail region. It is also the well-classified region.
Results
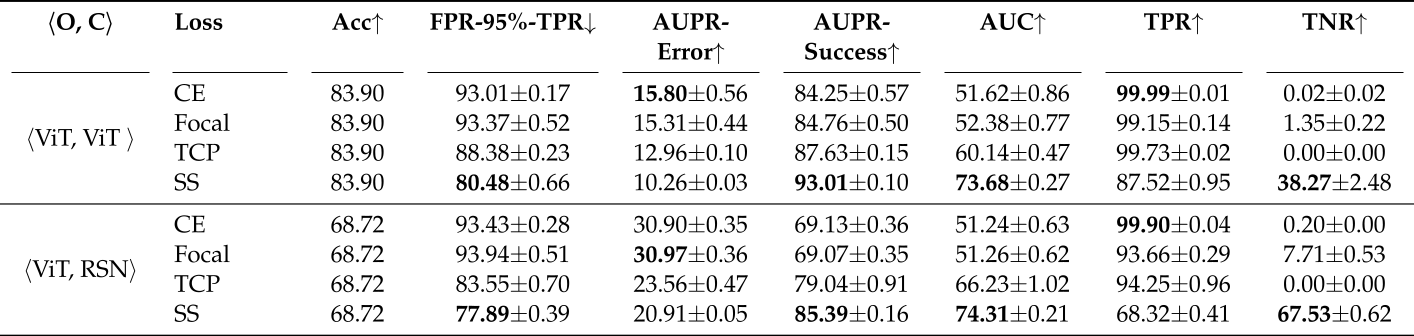
Here are the experimental results on ImageNet. The first column indicates the backbone models for the oracle and the classifier. O and C stand for oracle and classifier, respectively. Following TCP, we use FPR-95%-TPR, AUPR-Error, AUPR-Success, and AUC as the metrics. FPR-95%-TPR is the false positive rate (FPR) when true positive rate (TPR) is equal to 95%. AUPR is the area under the precision-recall curve. Specifically, AUPR-Success considers the correct prediction as the positive class, whereas AUPR-Error considers the incorrect prediction as the positive class. AUC is the area under the receiver operating characteristic curve, which is the plot of TPR versus FPR. Moreover, true positive rate and true negative rate are used to assess overfitting issue. Note that when TPR is close to 100% and TNR is close to 0%, it indicates the oracle is prone to view all the predictions to be trustworthy. In other words, it attempts to overfit training samples.
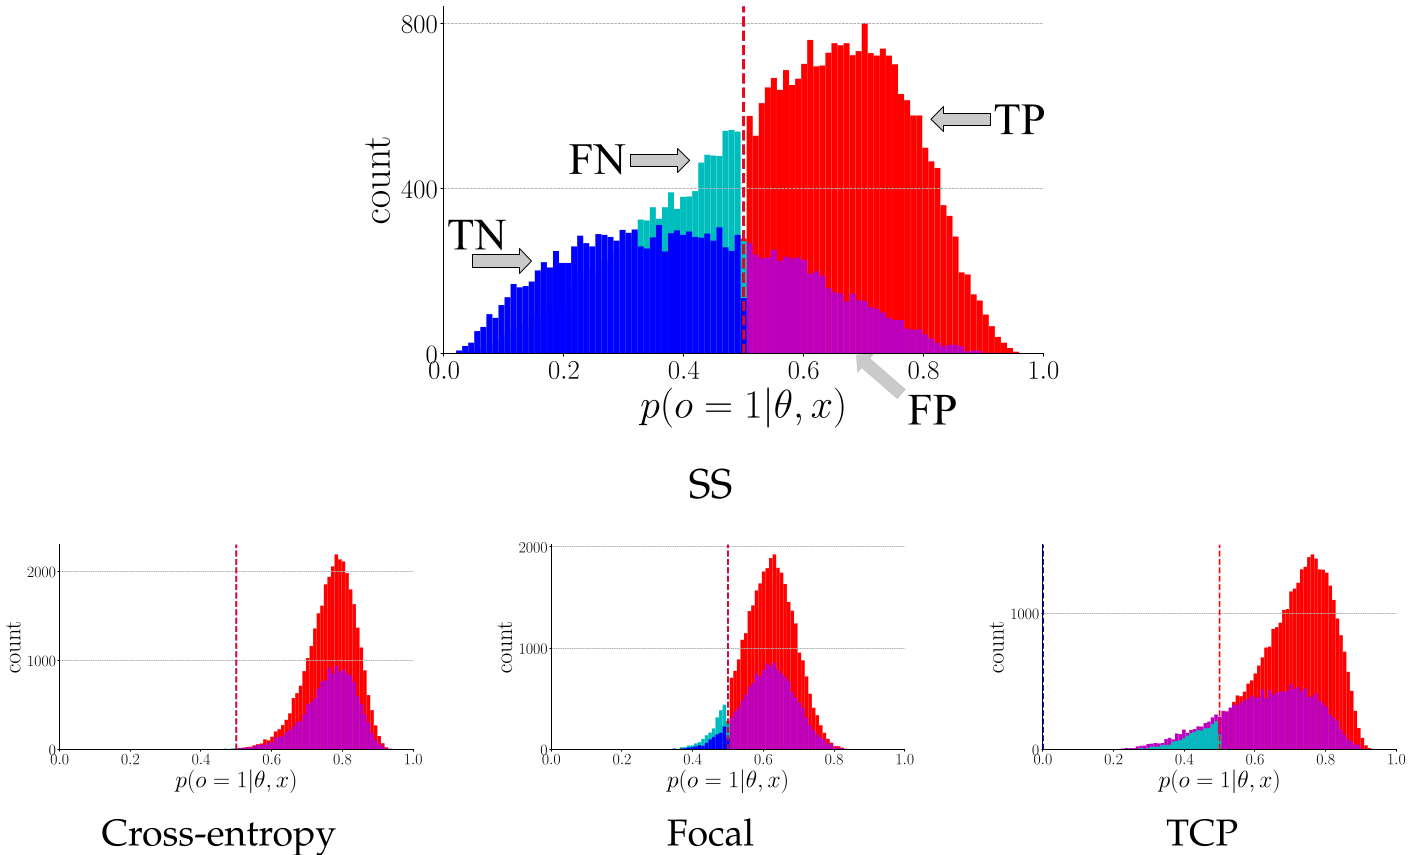
To intuitively understand the effects of all the loss functions, we plot the histograms of trustworthiness confidences w.r.t. true positive (TP), false positive (FP), true negative (TN), and false negative (FN) in this figure. Based on the trustworthiness histogram, we can see a trend that the proposed loss intends to push the false positives to the left and push the false negatives to the right such that all the negative and positive samples can be separated as much as possible. In contrast, the existing loss functions are difficult to separate the negative samples from the positive samples.
Download Links
Please cite the following paper if you use our dataset or code:
@inproceedings{Luo_NeurIPS_2021,
    title={Learning to Predict Trustworthiness with Steep Slope Loss},
    author={Luo, Yan and Wong, Yongkang and Kankanhalli, Mohan and Zhao, Qi},
    booktitle={Advances in Neural Information Processing Systems},
    year={2021}
}