As you have probably found, by default ROOT applies a palette of colors to histograms that is completely inappropriate:
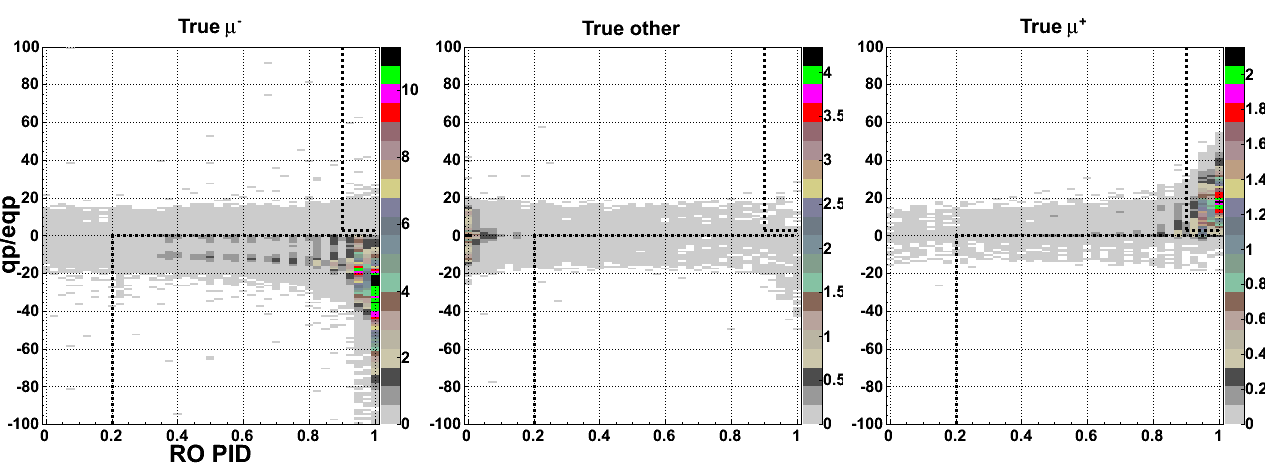
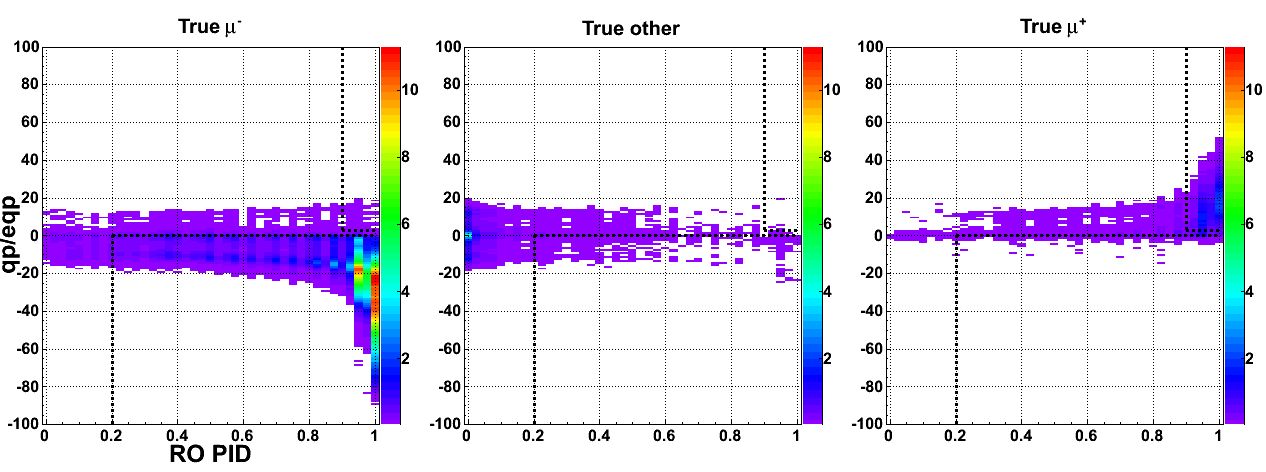
You've probably also found that you can fix this by calling gStyle->SetPalette(1, 0),
which gives you a rainbow palette instead. And you can also change the number of contours from the default 20 to 99
in the histogram editor, or 999 programmatically. (Whether it is good to have lots of colors depends on the
plot.)
But this is still troublesome because any non-zero bin gets colored a very eye-catching purple, even if it is extremely close to zero and not worthy of notice. You can fix this by defining a custom palette. Here's one:
int NRGBs = 7, NCont = 999;
gStyle->SetNumberContours(NCont);
Double_t stops[NRGBs] = { 0.00, 0.10, 0.25, 0.45, 0.60, 0.75, 1.00 };
Double_t red[NRGBs]   = { 1.00, 0.00, 0.00, 0.00, 0.97, 0.97, 0.10 };
Double_t green[NRGBs] = { 1.00, 0.97, 0.30, 0.40, 0.97, 0.00, 0.00 };
Double_t blue[NRGBs]  = { 1.00, 0.97, 0.97, 0.00, 0.00, 0.00, 0.00 };
TColor::CreateGradientColorTable(NRGBs, stops, red, green, blue, NCont);
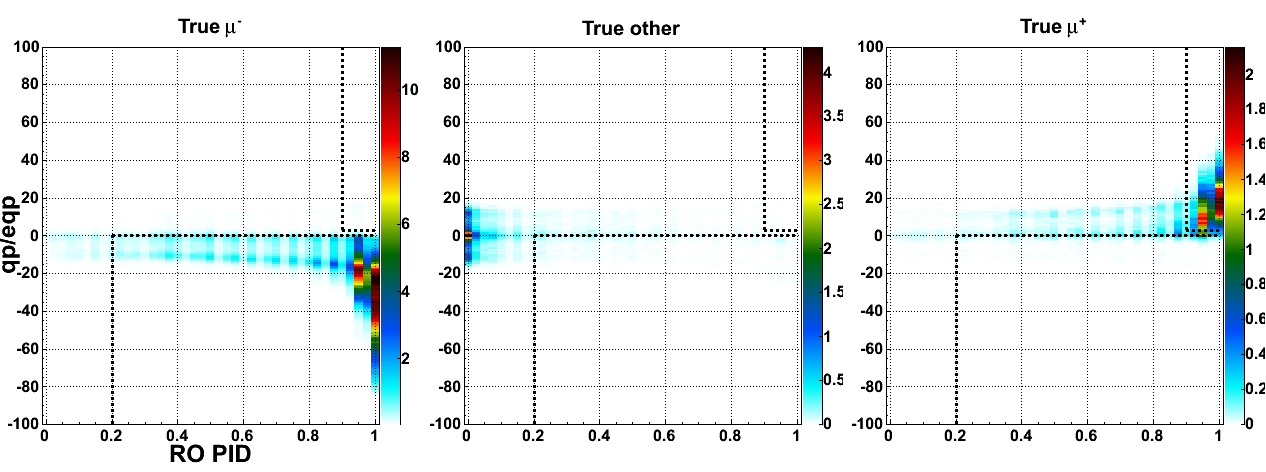
This palette fades to white on the low end so that people aren't distracted by very low values. While it's at it, it transitions from red to nearly black at the high end for more contrast. The fade to while is appropriate if very low values, in fact, don't matter. If they do, then the default rainbow palette above, or a different custom palette, is more appropriate.
Often it is useful to have a pallette that clearly distinguishes positive and negative values. Try this, in which red means positive, and black means negative:
int NRGBs = 3, NCont = 512;
gStyle->SetNumberContours(NCont);
Double_t stops[NRGBs] = { 0.00, 0.50, 1.00 };
Double_t red[NRGBs]   = { 0.00, 1.00, 1.00 };
Double_t green[NRGBs] = { 0.00, 1.00, 0.00 };
Double_t blue[NRGBs]  = { 0.00, 1.00, 0.00 };
TColor::CreateGradientColorTable(NRGBs, stops, red, green, blue, NCont);
Make sure that the centerpoint of the Z axis is zero.